All projects
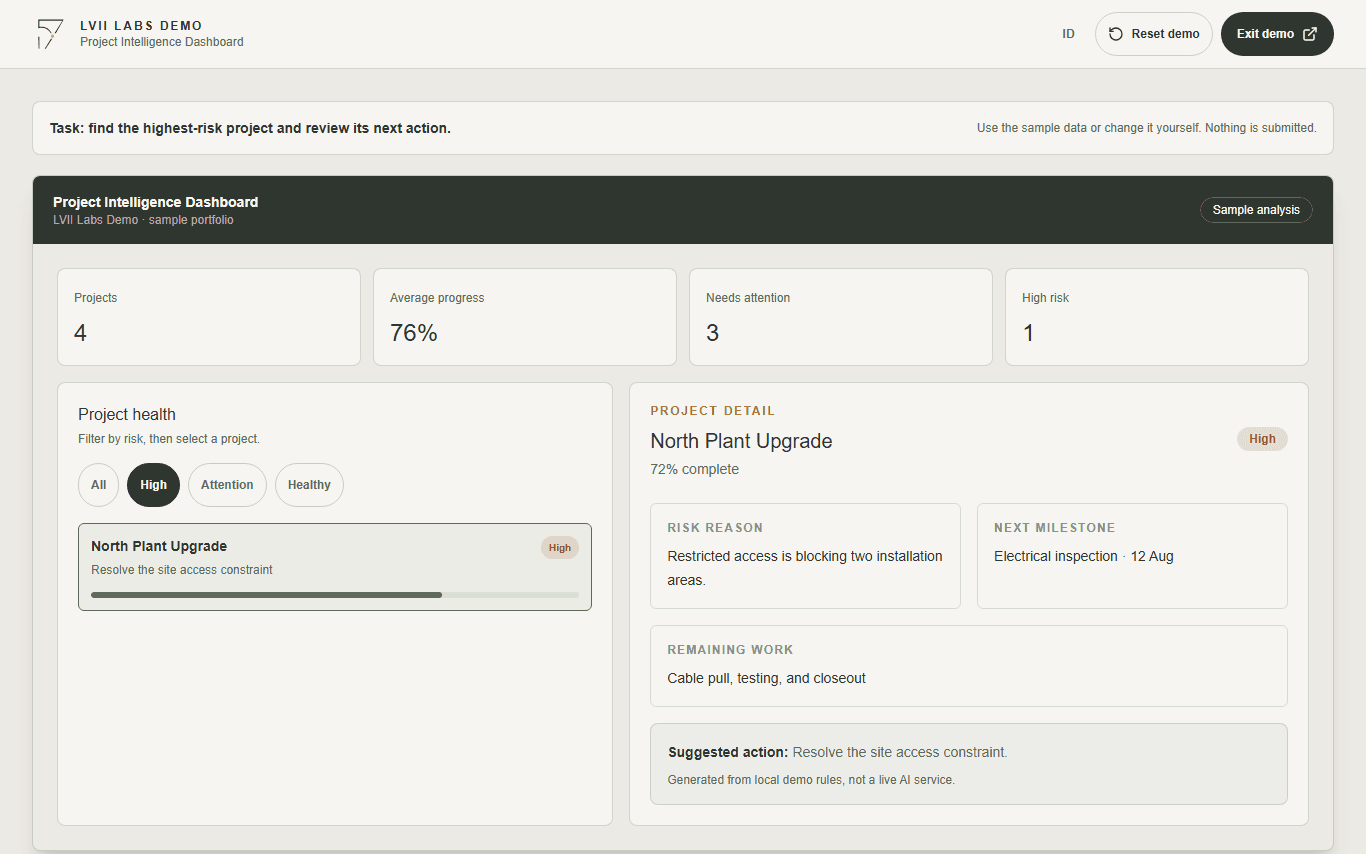
Project Intelligence Dashboard portfolio overview with KPI cards and project list

Portfolio overview

Project Intelligence Dashboard

Review portfolio health, filter delivery risk, and open a project to understand what needs attention next.

Built for delivery leads who need a quick view of project health before a status meeting.

  • Portfolio KPIs
  • Risk filtering
  • Projects needing action

The demo opens in a new tab, requires no login, and uses fictional sample data.

The operational problem

Project statuses spread across spreadsheets make it hard to see what needs attention before the next reporting cycle.

The approach

The dashboard leads with delivery risks and next actions, then supports each decision with compact portfolio metrics.

What the demo shows

The demo shows how project updates can become a view managers use to decide what needs attention next.

How it works

Follow the workflow step by step.

  1. 01

    Scan portfolio health

    Read progress, risk, and needs-attention totals at a glance.

  2. 02

    Filter by delivery risk

    Narrow the portfolio to healthy projects, projects needing attention, or high-risk projects.

  3. 03

    Inspect a project

    Open its risk reason, next milestone, remaining work, and required action.

  4. 04

    Prioritize the next action

    Use clearly labeled sample analysis to decide what to review first.

Product walkthrough

See each step before you try it.

Project Intelligence Dashboard portfolio overview with KPI cards and project list
The overview leads with delivery health instead of a wall of general analytics.
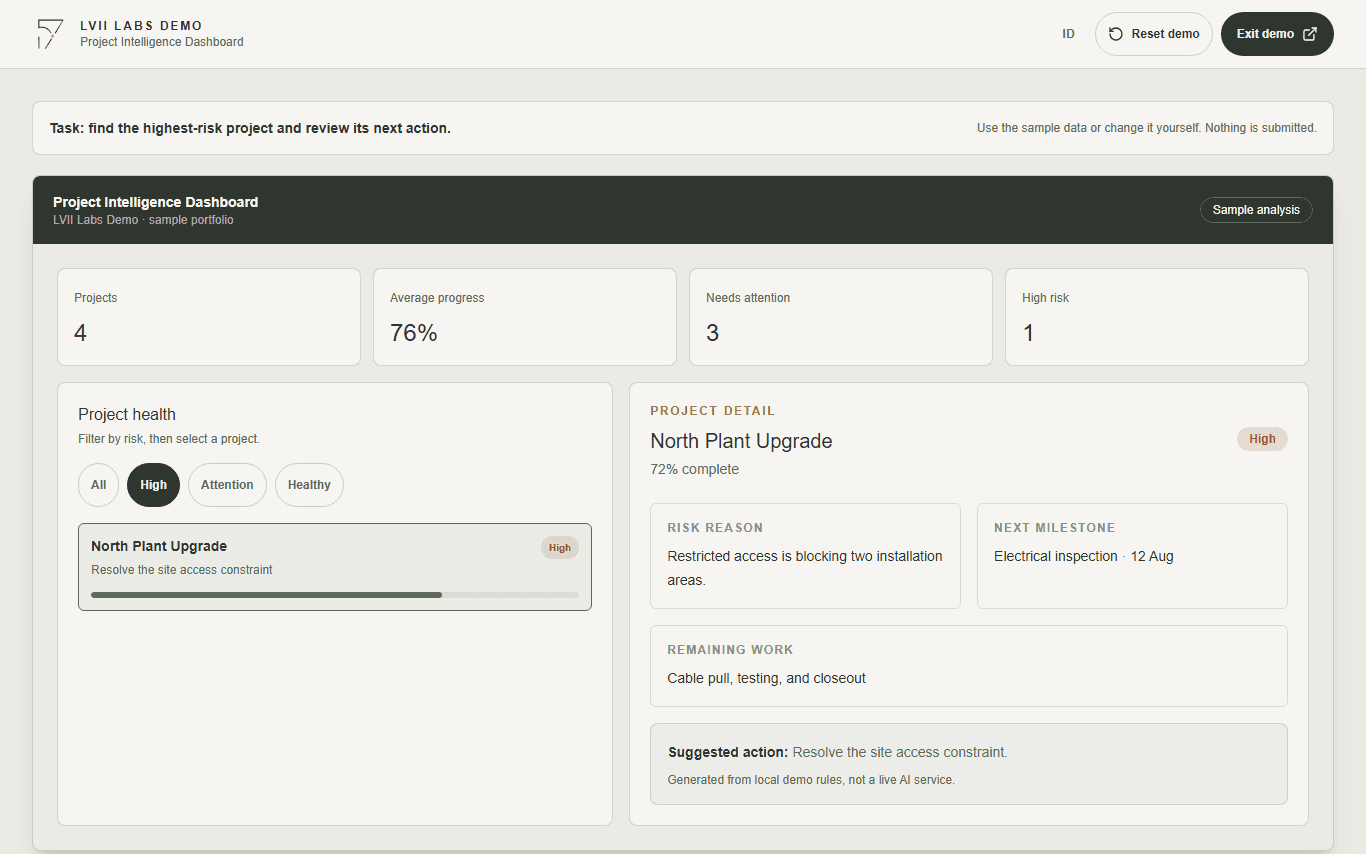
Project Intelligence Dashboard filtered to high-risk projects
Risk filters reduce the portfolio to the work that needs a decision now.
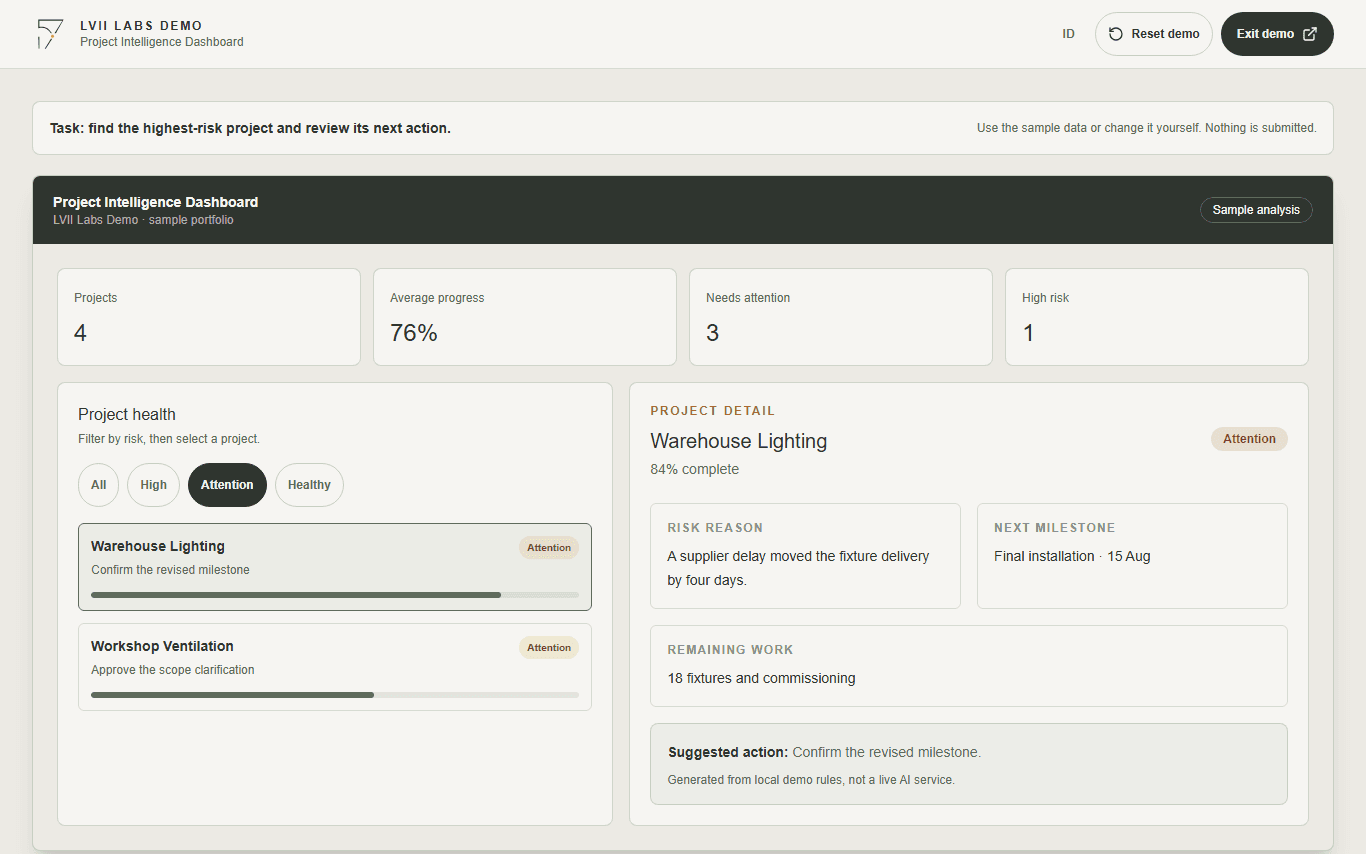
Project Intelligence Dashboard project detail with risk reason, milestone, and next action
Selecting a project explains why it is at risk and what the delivery lead can do next.
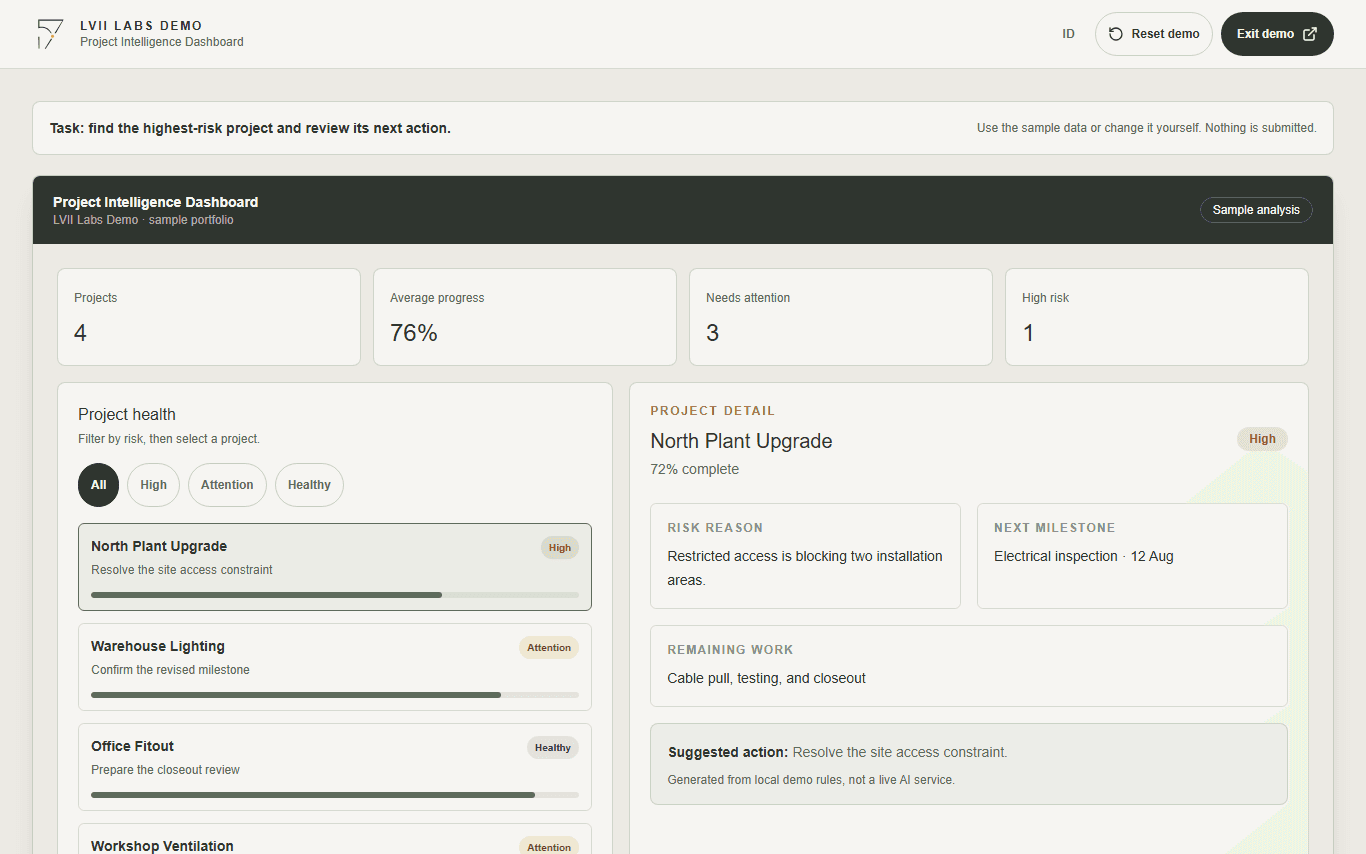
Project Intelligence Dashboard sample analysis for the selected high-risk project
Sample analysis is grounded in local demo rules and never presented as a live AI result.
Project Intelligence Dashboard displayed as stacked cards on a mobile screen
On smaller screens, KPIs and project details stack without hiding the decision-making context.

Technology

Built around a real operational task.

ReactDashboard UXRule-based sample analysis

Ready to try the workflow?

The demo runs entirely in your browser. Nothing you enter is stored or submitted.

Try live demo